| Transforming Live Nation Investor Presentation Thomas Weisel Partners Consumer Conference 2006 September 26, 2006 |
| Forward-Looking Statements Certain statements made in this presentation may be forward-looking statements involving known and unknown risks and uncertainties that may cause the actual results or performance of the company to be materially different from those implied by such forward-looking statements. Given these risks and uncertainties, undue reliance should not be placed on such forward-looking statements. The factors that could cause actual results to differ are discussed in our 2005 Annual Report on Form 10-K and in our reports on Form 10-Q and Form 8-K. Such risks and uncertainties include both company-specific risks and industry/general economic risks. The company disclaims any obligation to update any forward-looking statements that may be made in this presentation. |
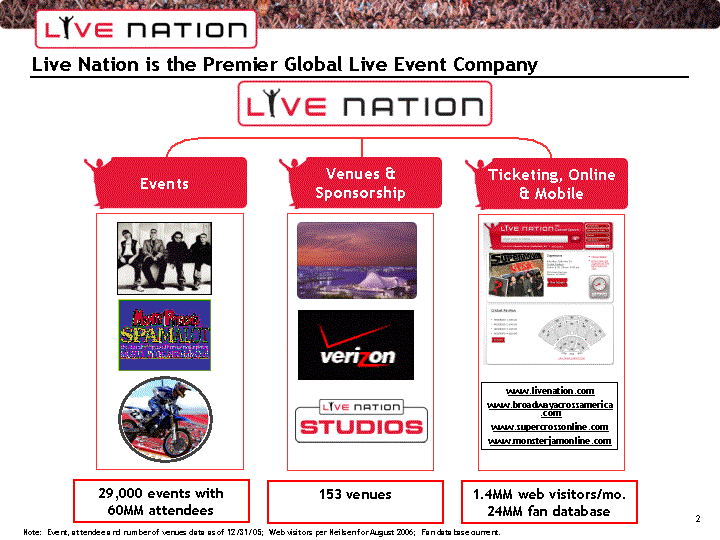
| www.livenation.com www.broadwayacrossamerica ..com www.supercrossonline.com www.monsterjamonline.com Events Venues & Sponsorship Ticketing, Online & Mobile Live Nation is the Premier Global Live Event Company 29,000 events with 60MM attendees 153 venues 1.4MM web visitors/mo. 24MM fan database Note: Event, attendee and number of venues data as of 12/31/05; Web visitors per Neilsen for August 2006; Fan database current. |
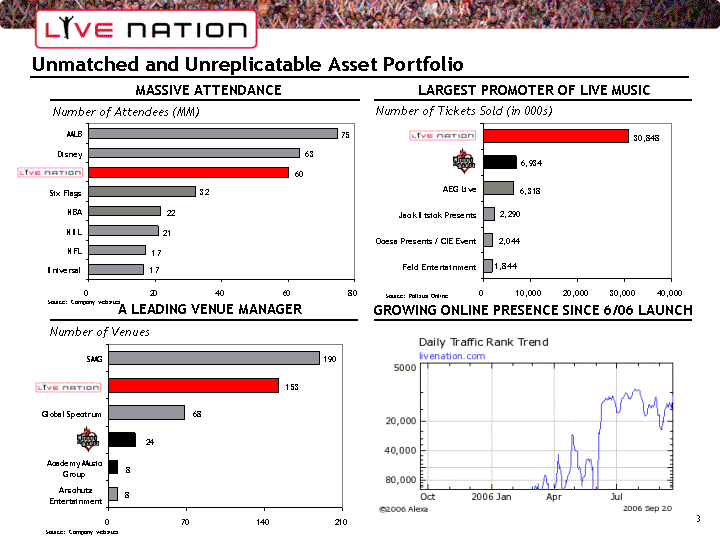
| Unmatched and Unreplicatable Asset Portfolio MASSIVE ATTENDANCE LARGEST PROMOTER OF LIVE MUSIC A LEADING VENUE MANAGER Number of Attendees (MM) Number of Tickets Sold (in 000s) Number of Venues Source: Pollstar Online Source: Company websites Source: Company websites GROWING ONLINE PRESENCE SINCE 6/06 LAUNCH |
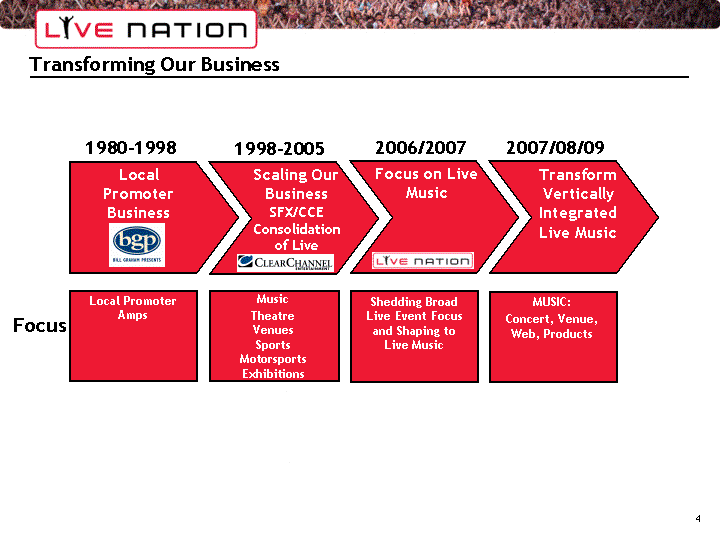
| Transforming Our Business 1980-1998 1998-2005 2006/2007 Local Promoter Business Scaling Our Business SFX/CCE Consolidation of Live Focus Local Promoter Amps Music Theatre Venues Sports Motorsports Exhibitions Shedding Broad Live Event Focus and Shaping to Live Music Focus on Live Music 2007/08/09 Transform Vertically Integrated Live Music MUSIC: Concert, Venue, Web, Products |
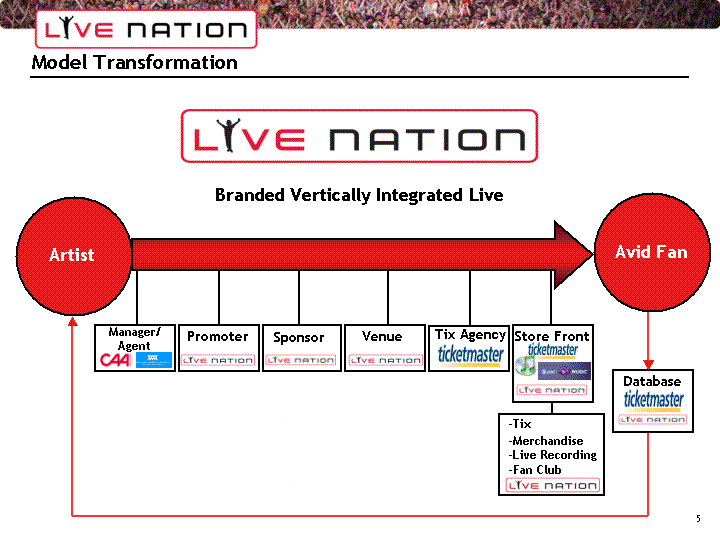
| Model Transformation Model Transformation Branded Vertically Integrated Live Artist Manager/ Agent Venue Tix Agency Store Front Database Promoter Avid Fan Avid Fan Sponsor - -Tix - -Merchandise - -Live Recording - -Fan Club - -VIP - -VIP - -VIP - -VIP - -VIP - -VIP |
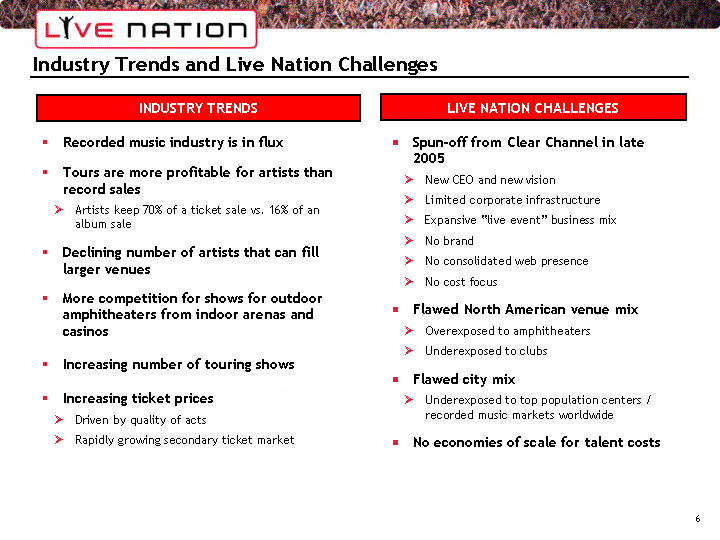
| Industry Trends and Live Nation Challenges INDUSTRY TRENDS LIVE NATION CHALLENGES Recorded music industry is in flux Tours are more profitable for artists than record sales Artists keep 70% of a ticket sale vs. 16% of an album sale Declining number of artists that can fill larger venues More competition for shows for outdoor amphitheaters from indoor arenas and casinos Increasing number of touring shows Increasing ticket prices Driven by quality of acts Rapidly growing secondary ticket market Spun-off from Clear Channel in late 2005 New CEO and new vision Limited corporate infrastructure Expansive "live event" business mix No brand No consolidated web presence No cost focus Flawed North American venue mix Overexposed to amphitheaters Underexposed to clubs Flawed city mix Underexposed to top population centers / recorded music markets worldwide No economies of scale for talent costs |
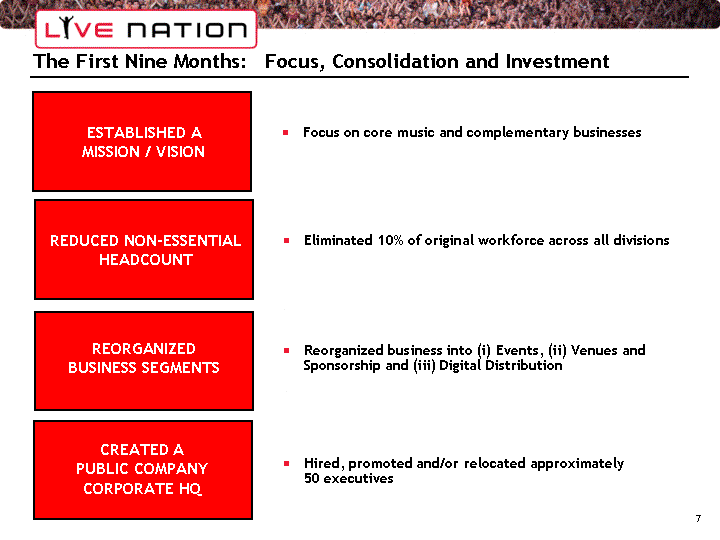
| The First Nine Months: Focus, Consolidation and Investment ESTABLISHED A MISSION / VISION Focus on core music and complementary businesses Eliminated 10% of original workforce across all divisions CREATED A PUBLIC COMPANY CORPORATE HQ Hired, promoted and/or relocated approximately 50 executives Reorganized business into (i) Events, (ii) Venues and Sponsorship and (iii) Digital Distribution REORGANIZED BUSINESS SEGMENTS REDUCED NON-ESSENTIAL HEADCOUNT ESTABLISHED A MISSION / VISION |
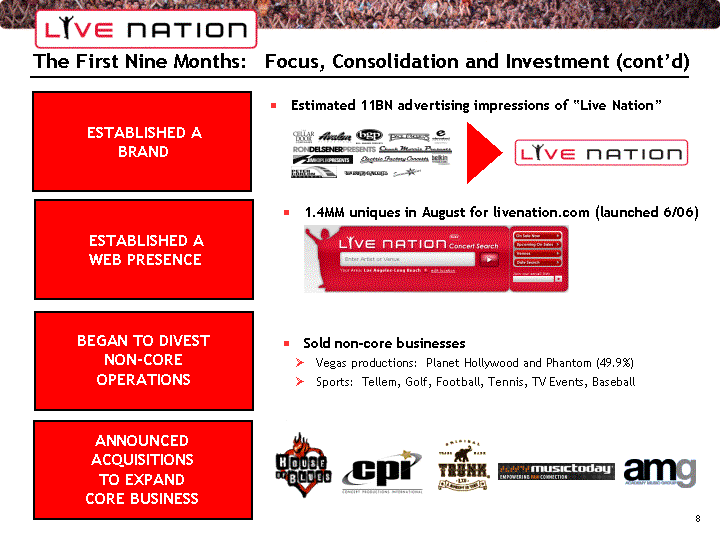
| The First Nine Months: Focus, Consolidation and Investment (cont'd) ESTABLISHED A MISSION / VISION 1.4MM uniques in August for livenation.com (launched 6/06) ANNOUNCED ACQUISITIONS TO EXPAND CORE BUSINESS Sold non-core businesses Vegas productions: Planet Hollywood and Phantom (49.9%) Sports: Tellem, Golf, Football, Tennis, TV Events, Baseball BEGAN TO DIVEST NON-CORE OPERATIONS ESTABLISHED A WEB PRESENCE ESTABLISHED A BRAND Estimated 11BN advertising impressions of "Live Nation" |
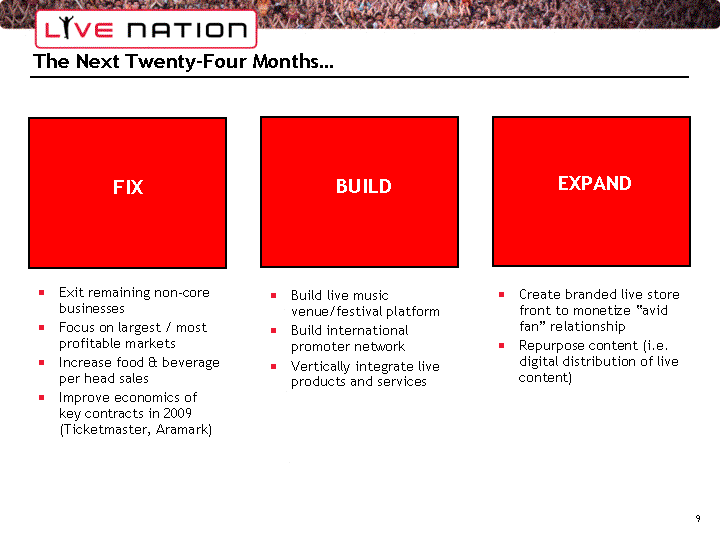
| The Next Twenty-Four Months... ESTABLISHED A MISSION / VISION BUILD FIX EXPAND Exit remaining non-core businesses Focus on largest / most profitable markets Increase food & beverage per head sales Improve economics of key contracts in 2009 (Ticketmaster, Aramark) Build live music venue/festival platform Build international promoter network Vertically integrate live products and services Create branded live store front to monetize "avid fan" relationship Repurpose content (i.e. digital distribution of live content) |
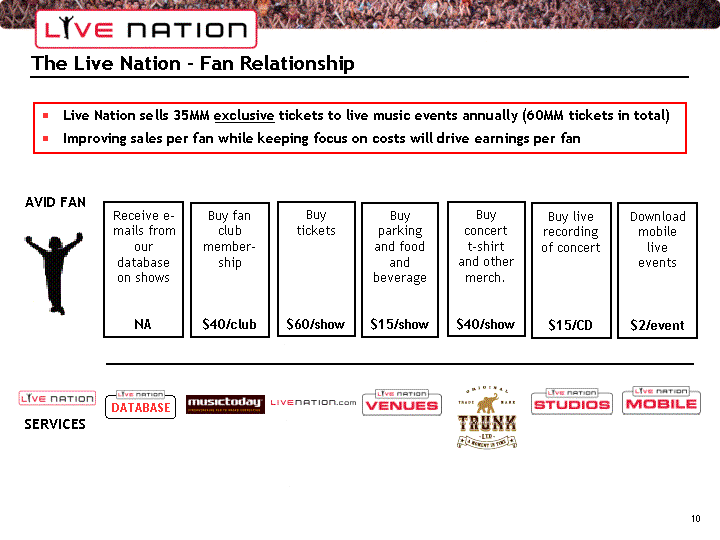
| The Live Nation - Fan Relationship AVID FAN Buy fan club member- ship $40/club Buy parking and food and beverage $15/show Buy live recording of concert $15/CD Download mobile live events $2/event SERVICES Buy tickets $60/show Receive e- mails from our database on shows NA DATABASE Buy concert t-shirt and other merch. $40/show Live Nation sells 35MM exclusive tickets to live music events annually (60MM tickets in total) Improving sales per fan while keeping focus on costs will drive earnings per fan |
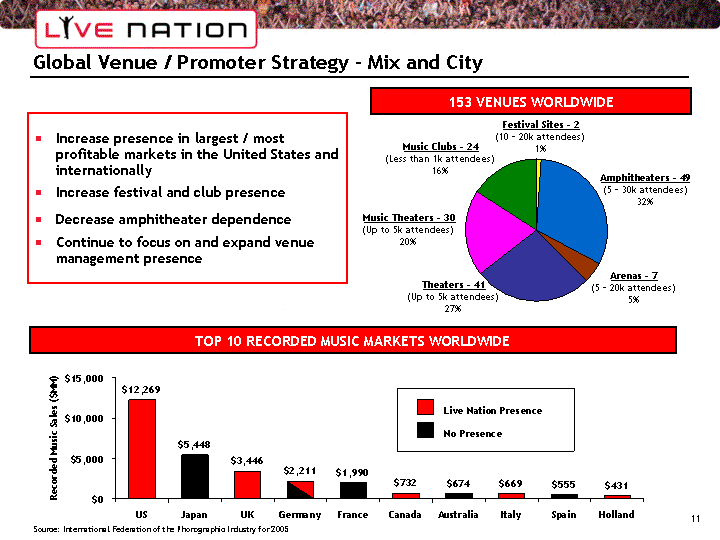
| Global Venue / Promoter Strategy - Mix and City Source: International Federation of the Phonographic Industry for 2005 Festival Sites - 2 (10 - 20k attendees) 1% Amphitheaters - 49 (5 - 30k attendees) 32% Arenas - 7 (5 - 20k attendees) 5% Music Theaters - 30 (Up to 5k attendees) 20% Music Clubs - 24 (Less than 1k attendees) 16% Increase presence in largest / most profitable markets in the United States and internationally Increase festival and club presence Decrease amphitheater dependence Continue to focus on and expand venue management presence Theaters - 41 (Up to 5k attendees) 27% TOP 10 RECORDED MUSIC MARKETS WORLDWIDE 153 VENUES WORLDWIDE |
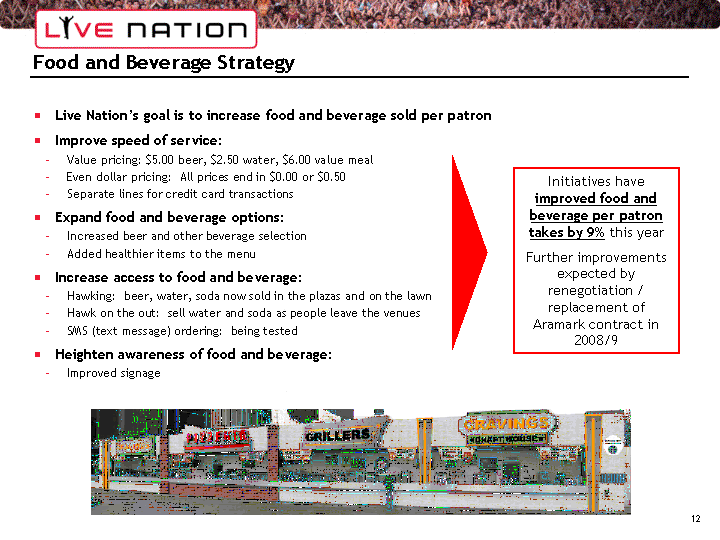
| Food and Beverage Strategy Live Nation's goal is to increase food and beverage sold per patron Improve speed of service: Value pricing: $5.00 beer, $2.50 water, $6.00 value meal Even dollar pricing: All prices end in $0.00 or $0.50 Separate lines for credit card transactions Expand food and beverage options: Increased beer and other beverage selection Added healthier items to the menu Increase access to food and beverage: Hawking: beer, water, soda now sold in the plazas and on the lawn Hawk on the out: sell water and soda as people leave the venues SMS (text message) ordering: being tested Heighten awareness of food and beverage: Improved signage Initiatives have improved food and beverage per patron takes by 9% this year Further improvements expected by renegotiation / replacement of Aramark contract in 2008/9 |
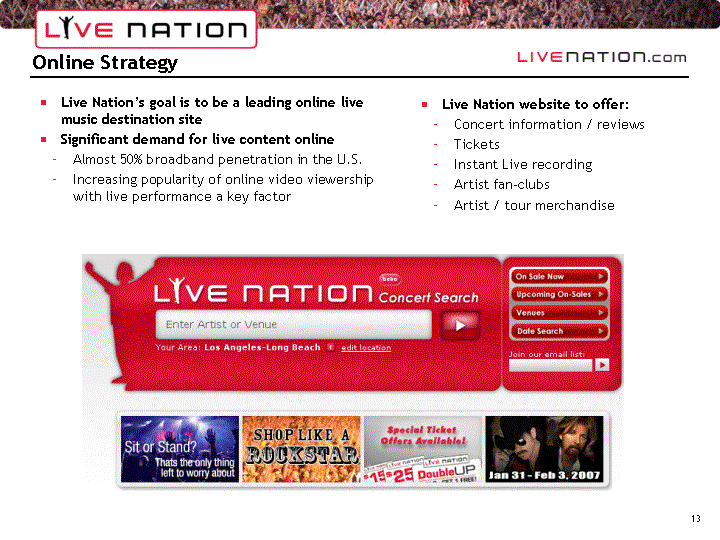
| Online Strategy Live Nation's goal is to be a leading online live music destination site Significant demand for live content online Almost 50% broadband penetration in the U.S. Increasing popularity of online video viewership with live performance a key factor Live Nation website to offer: Concert information / reviews Tickets Instant Live recording Artist fan-clubs Artist / tour merchandise |

| Live Content Strategy Wiring 120 venues to record live performances More than 600 shows captured and distributed since last year Total capital cost of less than $10MM Significant demand from traditional and new media Partner with distribution companies Significant traffic / sponsorship benefit to partners from access to live content MOBILE Live concert downloads Utilizes 3G network of Verizon, Cingular & Amp'd ONLINE OTHER Instant Live Per download / sale Motorsports downloads Revenue share with Google Video Live concert events Revenue share / fee for service |
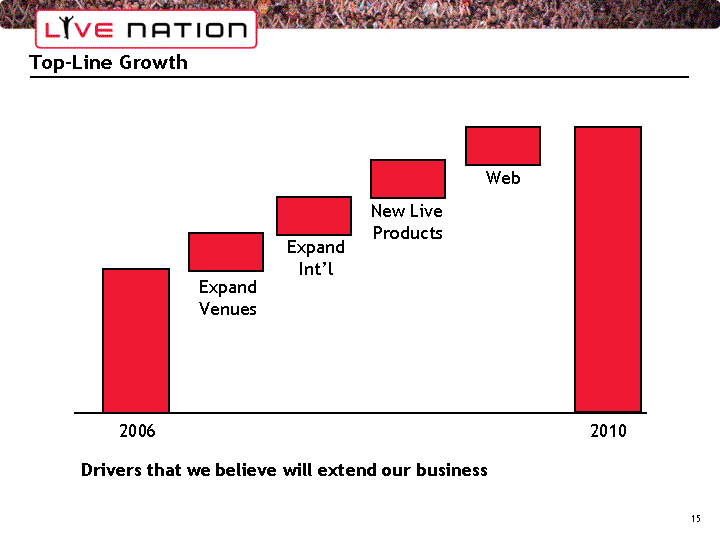
| Top-Line Growth 2006 2010 Expand Venues Expand Int'l New Live Products Web Drivers that we believe will extend our business |

| FINANCIAL OVERVIEW |
| Use of Non-GAAP Financial Measures This presentation includes certain non-GAAP financial measures. A reconciliation of each of these non-GAAP financial measures to its most directly comparable GAAP measure(s) is available on the investor relations portion of the company's website under the tab, "Financial Reports." |
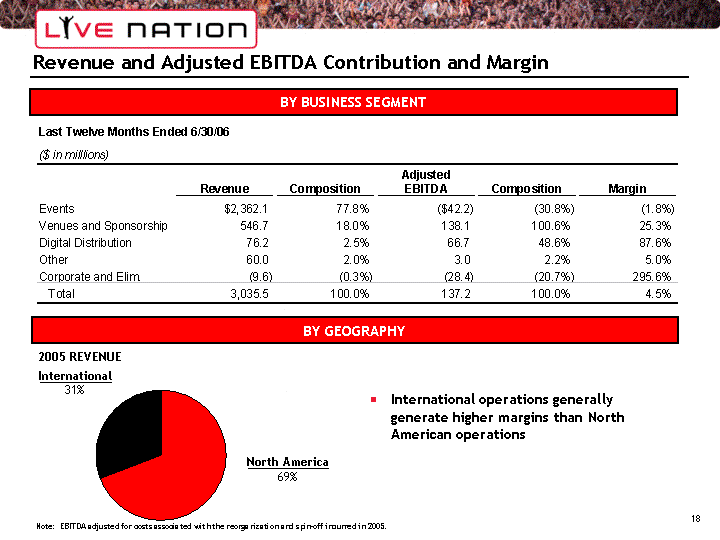
| Revenue and Adjusted EBITDA Contribution and Margin BY BUSINESS SEGMENT BY GEOGRAPHY North America 69% International 31% 2005 REVENUE International operations generally generate higher margins than North American operations Note: EBITDA adjusted for costs associated with the reorganization and spin-off incurred in 2005. |
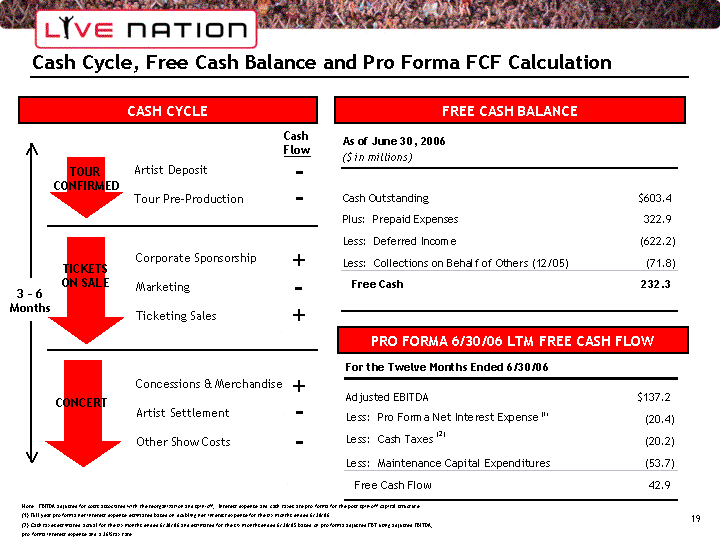
| Cash Cycle, Free Cash Balance and Pro Forma FCF Calculation FREE CASH BALANCE CASH CYCLE TOUR CONFIRMED TICKETS ON SALE CONCERT Cash Flow Artist Deposit Tour Pre-Production Corporate Sponsorship Marketing Ticketing Sales Concessions & Merchandise Artist Settlement Other Show Costs - - - - + - - + + - - 3 - 6 Months - - - - PRO FORMA 6/30/06 LTM FREE CASH FLOW |
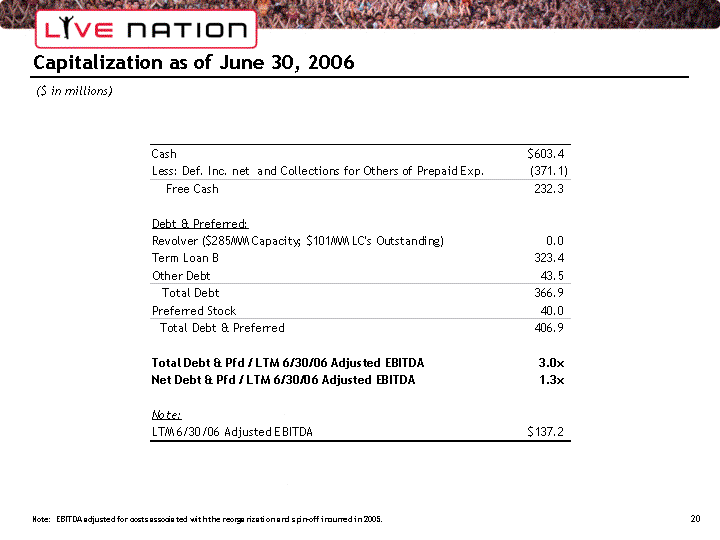
| Capitalization as of June 30, 2006 ($ in millions) Note: EBITDA adjusted for costs associated with the reorganization and spin-off incurred in 2005. |
| APPENDIX |
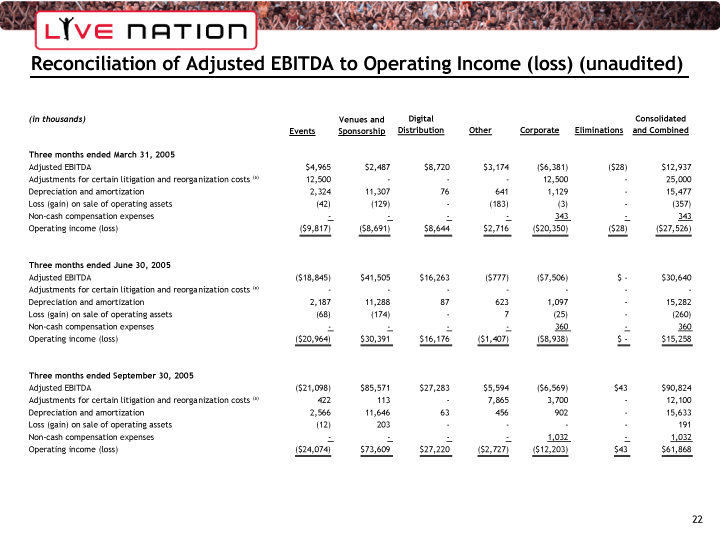
| Reconciliation of Adjusted EBITDA to Operating Income (loss) (unaudited) |
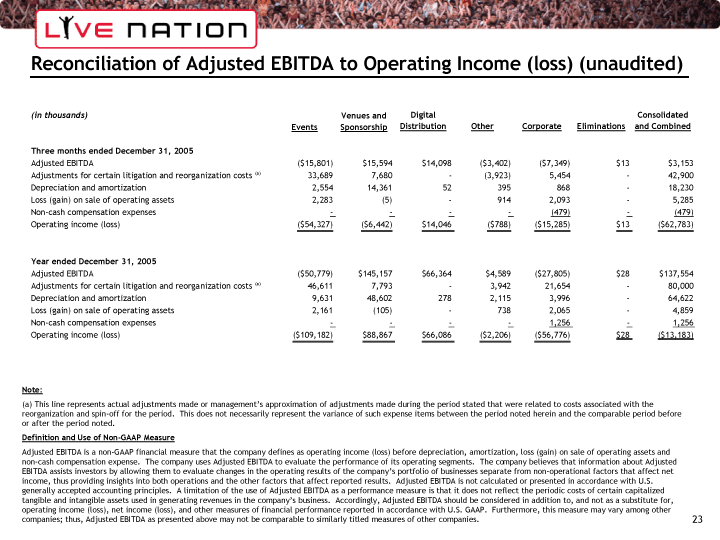
| Reconciliation of Adjusted EBITDA to Operating Income (loss) (unaudited) Definition and Use of Non-GAAP Measure Adjusted EBITDA is a non-GAAP financial measure that the company defines as operating income (loss) before depreciation, amortization, loss (gain) on sale of operating assets and non-cash compensation expense. The company uses Adjusted EBITDA to evaluate the performance of its operating segments. The company believes that information about Adjusted EBITDA assists investors by allowing them to evaluate changes in the operating results of the company's portfolio of businesses separate from non-operational factors that affect net income, thus providing insights into both operations and the other factors that affect reported results. Adjusted EBITDA is not calculated or presented in accordance with U.S. generally accepted accounting principles. A limitation of the use of Adjusted EBITDA as a performance measure is that it does not reflect the periodic costs of certain capitalized tangible and intangible assets used in generating revenues in the company's business. Accordingly, Adjusted EBITDA should be considered in addition to, and not as a substitute for, operating income (loss), net income (loss), and other measures of financial performance reported in accordance with U.S. GAAP. Furthermore, this measure may vary among other companies; thus, Adjusted EBITDA as presented above may not be comparable to similarly titled measures of other companies. Note: (a) This line represents actual adjustments made or management's approximation of adjustments made during the period stated that were related to costs associated with the reorganization and spin-off for the period. This does not necessarily represent the variance of such expense items between the period noted herein and the comparable period before or after the period noted. |