Exhibit 99.1
LIVE NATION ENTERTAINMENT
REPORTS FIRST QUARTER 2024 RESULTS
“Our Q1 results demonstrate that live events remain a priority for fans around the world. Global fan demand is stronger than ever, more artists are out on the road, and more venues are being added to bring them together. While operating income will be impacted by one-time accruals, we’re on track to deliver another record year with double-digit AOI growth and years of momentum still to come.”
–Michael Rapino, President and CEO, Live Nation Entertainment
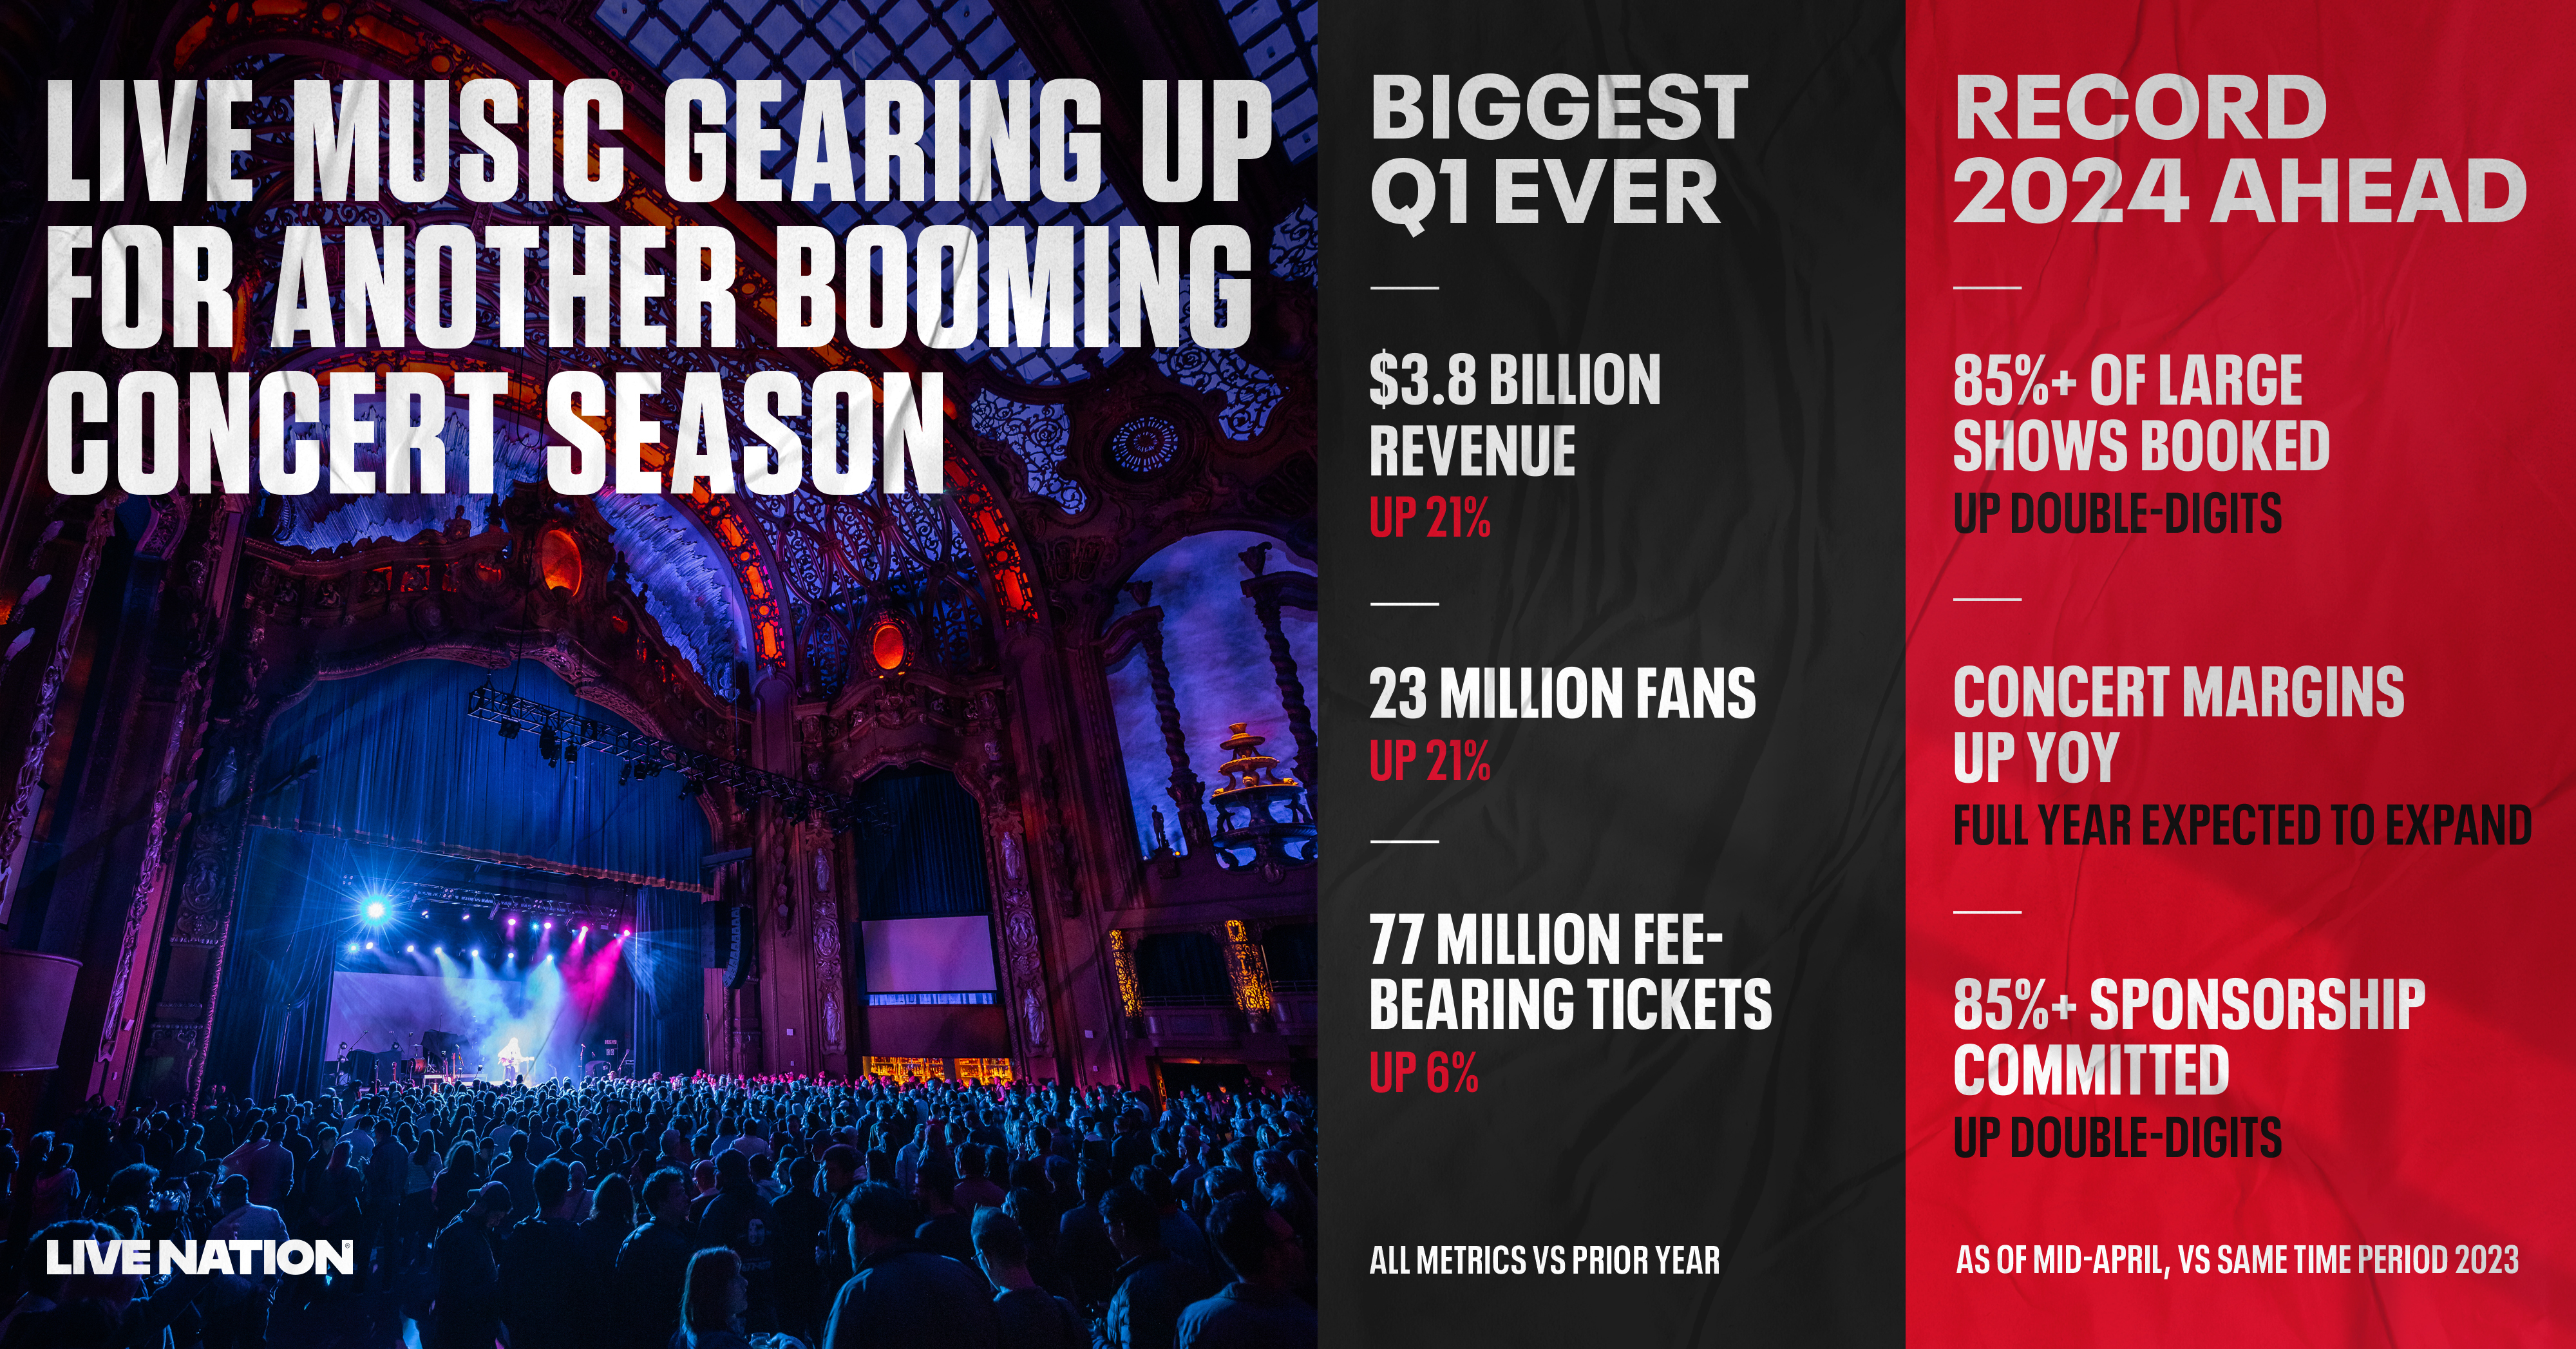
Quarterly Highlights (vs prior year): Record Q1 As Demand for Live Events Remains Strong
(reported FX)
•Revenue up 21% to $3.8 billion
•Operating loss of $37 million
•Adjusted operating income up 15% to $367 million
•Fan growth up 21% to 23 million fans
•Food and beverage spending up 10% at U.S. theaters and clubs
•77 million fee-bearing tickets sold
•Sponsorship revenue up 24%, highest Q1 ever
View how these results compare to past quarters in the 1Q24 Trended Results Grid:
https://investors.livenationentertainment.com/financial-information/financial-results
2024 Leading Indicators Point to Another Record Year
(based on leading indicators through mid-April vs same period last year)
•Continued strong fan demand:
◦Live Nation concert ticket sales for overall arena and amphitheater shows pacing up double-digits
◦Confirmed shows for large venues (stadiums, arenas, and amphitheaters) up double-digits with growth led by arenas and amphitheaters
◦Over 85% of full-year shows at large venues booked, compared to approximately 75% last year
•More demand for global content:
◦Fan count for Q1 shows nearly doubled for International artists across top 50 global tours compared to five years ago
◦Year-to-date ticket sales per show for Latin shows in the U.S. up double-digits year-on-year
◦Year-to-date confirmed U.S. show count for Afrobeats up 400% and Latin up approximately 40% year-on-year, with similar trends in Europe
•Venue Nation expands global portfolio:
◦Plans to open at least 12 major venues globally in 2024/25, creating capacity for over eight million expected additional fans
◦Additionally, major refurbishment of two venues in the U.S. and Mexico to be completed in 2024
◦Expected returns to average over 20%, with a proven track record on recent openings
•Ticketing continues to expand globally:
◦Approximately seven million net new enterprise tickets signed year-to-date, with 70% from International markets
◦112 million fee-bearing tickets sold year-to-date, up 4%
•Sponsorship continues to leverage our global scale and unique platform:
◦Over 85% of expected sponsorship commitments for the year booked, up double-digits
◦Non-alcoholic beverages, consumer packaged goods, and retail categories each up double-digits
Concerts Deliver Record Q1 with Momentum Accelerating Into the Summer Season (vs same period last year)
•Revenue up 26% to $2.9 billion
•AOI of $3 million, and $12 million on a constant currency basis
•Q1 margins expanded, even with increased arena activity
•Full-year margins expected to be higher than last year, with the magnitude of margin expansion impacted by venue mix and advertising costs in Q4 related to 2025 activity
•AOI growth expected to be primarily driven by Q2 and Q3 activity
Arenas and Festivals Led Q1 Fan Growth (vs same period last year)
•Q1 fan growth up 21% to 23 million fans:
◦Arenas led attendance growth, up 40% to nearly 10 million fans globally
◦Festival attendance growth of double-digits, driven by Latin American markets
•Artists touring again this year are achieving increased sell throughs and higher grosses per show at arenas and amphitheaters relative to their 2023 tours
•Overall arena sell through and grosses remain strong, even with a large increase in show count
•Year-to-date ticket sales of 86 million for shows this year, consistent with 2023 despite reduced stadium activity
Venue Nation Enhancing the Fan Experience Globally (vs same period last year)
•Q1 food and beverage spending up over 10% at U.S. theaters and clubs
•Venue Nation fan count expected to grow double-digits with more shows at amphitheaters and other operated venues
•Profitability per fan at amphitheaters expected to increase double-digits this year, with these venues delivering over 2.5x the per fan profitability of similarly sized third-party venues
Experiential Economy Drives Q1 Ticketing Results (vs same period last year)
•Revenue up 7% to $723 million
•AOI up 5% to $284 million
•Record Q1 operating metrics:
◦Approximately 77 million fee-bearing tickets sold, driven by double-digit growth in International markets
◦Fee-bearing Gross Transaction Value up to nearly $8 billion, with growth driven by International markets
•Full-year margins expected to be consistent with last year
Sponsorship Q1 Growth Reflects Attractiveness of our Global Platforms (vs same period last year)
•Revenue up 24% to $211 million
•AOI up 36% to $130 million
•Strong growth in Q1 driven by our increasingly global platform, enabling more year-round activity, with a similar trend expected in Q4
•Full-year margins expected to be consistent with last year
Continued Global Expansion with Existing and New Partners
•New partners added this year include Jaguar Land Rover’s Defender and U.K. festival headline partners Rockstar Energy and Liquid Death
•Expanded relationships with GNP in Mexico and Cisco and Bacardi in the U.S.
- - - - - - - - -
Additional Financial Information
•2024 capital expenditures estimated to be $600 million
◦Three-quarters of total capex driven by Venue Nation: five venues account for approximately 40% of total venue spend
◦Most of the capex increase relative to our prior projection due to additional venue expansion opportunities, including a stadium in South America to be modeled after Foro Sol
•Based on current projections, the impact of foreign exchange rates on revenue, operating income, and AOI for the full-year is expected to be immaterial, with a larger impact to net income and further impact to EPS given expected growth in accretion
•Supplemental Information:
◦Net income reduced by $97 million comprised of accrual related to Astroworld litigation, net of Q1 mark to market gains in investments
◦Accretion expected to grow in line with AOI for the full year
◦Depreciation and amortization expense expected to be $75 million higher than 2023
◦Non-controlling interest and tax expenses for the full year expected to grow in line with AOI
•2024 share count not expected to change materially from 2023
Balance Sheet and Liquidity Gives Us Financial Flexibility
•Full-year AOI to FCF conversion expected to be in line with 2023 levels, excluding potential payout associated with legal accrual
•Event-related deferred revenue of $4.4 billion consistent with Q1 2023 level
•Q1 ended with $6.5 billion in cash and cash equivalents, including $1.4 billion in ticketing client cash and $1.4 billion in free cash
•Approximately 93% of debt is at a fixed rate, with an average cost of debt of 4.6%
The company will webcast a teleconference today at 2:00 p.m. Pacific Time to discuss its financial performance, operational matters and potentially other material developments. Interested parties should visit the “News / Events” section of the company’s website at investors.livenationentertainment.com to listen to the webcast. Supplemental statistical and financial information to be provided on the call, if any, will be posted to the “Financial Info” section of the website. A replay of the webcast will also be available on the Live Nation website. The link to the 1Q24 Trended Results Grid is provided above for convenience and such grid is not a part of, or incorporated into, this press release or any SEC filings that include this press release.
Notice Regarding Financial Statements
The company has provided certain financial statements at the end of this press release for reference. These financial statements should be read in conjunction with the full financial statements, and the notes thereto, set forth in the company’s Quarterly Report on Form 10-Q filed with the Securities and Exchange Commission today and available on the SEC’s website at sec.gov.
About Live Nation Entertainment:
Live Nation Entertainment, Inc. (NYSE: LYV) is the world’s leading live entertainment company comprised of global market leaders: Ticketmaster, Live Nation Concerts, and Live Nation Media & Sponsorship. For additional information, visit investors.livenationentertainment.com.
| | | | | |
Investor Contact: | Media Contact: |
Amy Yong | Kaitlyn Henrich |
IR@livenation.com | Media@livenation.com |
(310) 867-7143 | |
FINANCIAL HIGHLIGHTS – FIRST QUARTER
(unaudited; $ in millions)
| | | | | | | | | | | | | | | | | | | | | | | | | | | | | | | | | | | |
| Q1 2024 Reported | | Q1 2023 Reported | | Growth | | Q1 2024 Currency Impacts | | Q1 2024 Constant Currency | | Growth at Constant Currency |
| Revenue | | | | | | | | | | | |
Concerts | $ | 2,879.4 | | | $ | 2,281.2 | | | 26 | % | | $ | 9.6 | | | $ | 2,889.0 | | | 27 | % |
Ticketing | 723.2 | | | 677.7 | | | 7 | % | | (0.9) | | | 722.3 | | | 7 | % |
Sponsorship & Advertising | 211.3 | | | 170.1 | | | 24 | % | | (1.4) | | | 209.9 | | | 23 | % |
Other and Eliminations | (14.4) | | | (1.6) | | | * | | 0.2 | | | (14.2) | | | * |
| $ | 3,799.5 | | | $ | 3,127.4 | | | 21 | % | | $ | 7.5 | | | $ | 3,807.0 | | | 22 | % |
| | | | | | | | | | | |
| | | | | | | | | | | |
| | | | | | | | | | | |
| | | | | | | | | | | |
| | | | | | | | | | | |
| | | | | | | | | | | |
| Consolidated Operating Income (Loss) | $ | (36.5) | | | $ | 142.8 | | | * | | $ | 12.9 | | | $ | (23.6) | | | * |
| | | | | | | | | | | |
| Adjusted Operating Income (Loss) | | | | | | | | | | | |
Concerts | $ | 3.1 | | | $ | 0.8 | | | * | | $ | 8.7 | | | $ | 11.8 | | | * |
Ticketing | 284.1 | | | 271.1 | | | 5 | % | | 0.8 | | | 284.9 | | | 5 | % |
Sponsorship & Advertising | 130.0 | | | 95.4 | | | 36 | % | | 1.2 | | | 131.2 | | | 38 | % |
Other and Eliminations | (7.2) | | | (7.8) | | | * | | 0.0 | | | (7.2) | | | * |
Corporate | (42.6) | | | (39.8) | | | (7) | % | | 0.0 | | | (42.6) | | | (7) | % |
| $ | 367.4 | | | $ | 319.7 | | | 15 | % | | $ | 10.7 | | | $ | 378.1 | | | 18 | % |
* Percentages are not meaningful
Reconciliation of Adjusted Operating Income to Operating Income (Loss) (Unaudited)
| | | | | | | | | | | |
| | | | Q1 2024 | Q1 2023 |
| | | | (in millions) |
| Adjusted Operating Income | | | | $ | 367.4 | | $ | 319.7 | |
| Acquisition expenses | | | | 30.6 | | 13.2 | |
| Amortization of non-recoupable ticketing contract advances | | | | 24.1 | | 20.4 | |
| Depreciation and amortization | | | | 132.6 | | 115.2 | |
| Loss (gain) on disposal of operating assets | | | | (0.7) | | 0.5 | |
| Astroworld estimated loss contingencies | | | | 185.9 | | — | |
| Stock-based compensation expense | | | | 31.4 | | 27.6 | |
| Operating Income (Loss) | | | | $ | (36.5) | | $ | 142.8 | |
KEY OPERATING METRICS
(unaudited)
| | | | | | | | | | | | | | | | | |
| | | | | | Q1 2024 | | Q1 2023 | | |
| | | | | (in thousands except estimated events) |
Concerts (1) | | | | | | | | | |
| Estimated events: | | | | | | | | | |
North America (2) | | | | | 7,177 | | | 6,309 | | | |
| International | | | | | 4,026 | | | 3,596 | | | |
| Total estimated events | | | | | 11,203 | | | 9,905 | | | |
| Estimated fans: | | | | | | | | | |
North America (2) | | | | | 10,891 | | | 7,658 | | | |
| International | | | | | 12,039 | | | 11,243 | | | |
| Total estimated fans | | | | | 22,930 | | | 18,901 | | | |
Ticketing (3) | | | | | | | | | |
| Estimated number of fee-bearing tickets | | | | | 76,578 | | | 72,266 | | | |
| Estimated number of non-fee-bearing tickets | | | | | 78,432 | | | 73,200 | | | |
| Total estimated tickets sold | | | | | 155,010 | | | 145,466 | | | |
_________
(1)Events generally represent a single performance by an artist. Fans generally represent the number of people who attend an event. Festivals are counted as one event in the quarter in which the festival begins, but the number of fans is based on the days the fans were present at the festival and thus can be reported across multiple quarters. Events and fan attendance metrics are estimated each quarter.
(2)North America refers to our events and fans within the United States and Canada.
(3)The fee-bearing tickets estimated above include primary and secondary tickets that are sold using our Ticketmaster systems or that we issue through affiliates. This includes primary tickets sold during the year regardless of event timing, except for our own events where our concert promoters control ticketing which are reported when the events occur. The non-fee-bearing tickets estimated above include primary tickets sold using our Ticketmaster systems, through season seat packages and our venue clients’ box offices, along with tickets sold on our “do it yourself” platform. These ticket metrics are net of any refunds requested and any cancellations that occurred during the period, which may result in a negative number.
Reconciliation of Certain Non-GAAP Measures to Their Most Directly Comparable GAAP Measures (Unaudited)
Reconciliation of Free Cash Flow — Adjusted to Net Cash Provided by Operating Activities
| | | | | | | | | | | |
| ($ in millions) | Q1 2024 | | Q1 2023 |
| Net cash provided by operating activities | $ | 988.9 | | | $ | 1,155.8 | |
| Less: Changes in operating assets and liabilities (working capital) | (917.4) | | | (902.3) | |
| Free cash flow from earnings | $ | 71.5 | | | $ | 253.5 | |
| Less: Maintenance capital expenditures | (22.5) | | | (8.6) | |
| Distributions to noncontrolling interests | (56.2) | | | (54.9) | |
| Free cash flow — adjusted | $ | (7.2) | | | $ | 190.0 | |
| | | |
| Net cash used in investing activities | $ | (170.7) | | | $ | (59.8) | |
| | | |
| Net cash provided by (used in) financing activities | $ | (478.4) | | | $ | 225.7 | |
Reconciliation of Free Cash to Cash and Cash Equivalents
| | | | | |
| ($ in millions) | March 31,
2024 |
| Cash and cash equivalents | $ | 6,501.7 | |
| Client cash | (1,406.1) | |
| Deferred revenue — event-related | (4,360.3) | |
| Accrued artist fees | (230.3) | |
| Collections on behalf of others | (112.2) | |
| Prepaid expenses — event-related | 977.5 | |
| Free cash | $ | 1,370.3 | |
Forward-Looking Statements, Non-GAAP Financial Measures and Reconciliations:
Certain statements in this press release, including the Supplemental Information that follows, constitute "forward-looking statements" within the meaning of the Private Securities Litigation Reform Act of 1995. Such forward-looking statements include, but are not limited to statements regarding leading indicators pointing to another record year; momentum accelerating into the summer concert season; operating income being impacted by one-time accruals, with the company being on track to deliver another record year with double-digit adjusted operating income growth and years of momentum still to come; pacing for Live Nation concert ticket sales for overall arena and amphitheater shows this year; expectations that Concerts adjusted operating income growth will be driven by second and third quarter activity in 2024; expected Venue Nation fan count growth with more shows at amphitheaters and other operated venues; expected increase in profitability per fan at the company’s amphitheaters, with operated amphitheaters expected to generate 2.5x the per fan profitability of similarly sized third-party venues; the company’s plans to expand Venue Nation’s global portfolio, including projected returns from new venues; expectations for growth in Sponsorship in the fourth quarter of 2024, similar to the trend for the first quarter of the year; full-year margins expectations for the company’s Concerts, Ticketing and Sponsorship businesses; expectations for adjusted operating income to free cash flow conversion for 2024; estimated 2024 capital expenditures, including the percentage spent on revenue-generating projects and the expected returns for Venue Nation projects; the anticipated impact of foreign exchange rates on the company’s results of operations in 2024; expected depreciation and amortization expense in 2024; expectations for annual accretion growth for the year; anticipated growth in non-controlling interest and tax expenses in 2024; and expected 2024 share count.
Live Nation wishes to caution you that there are some known and unknown factors that could cause actual results to differ materially from any future results, performance or achievements expressed or implied by such forward-looking statements, including but not limited to operational challenges in achieving strategic objectives and executing on the company's plans, the risk that the company's markets do not evolve as anticipated, the potential impact of any economic slowdown and operational challenges associated with selling tickets and staging events.
Live Nation refers you to the documents it files from time to time with the U.S. Securities and Exchange Commission, or SEC, specifically the section titled “Item 1A. Risk Factors” of the company’s most recent Annual Report filed on Form 10-K, and Quarterly Reports on Form 10-Q and its Current Reports on Form 8-K, which contain and identify other important factors that could cause actual results to differ materially from those contained in the company’s projections or forward-looking statements. You are cautioned not to place undue reliance on these forward-looking statements which speak only as of the date on which they are made. All subsequent written and oral forward-looking statements by or concerning Live Nation are expressly qualified in their entirety by the cautionary statements above. Live Nation does not undertake any obligation to publicly update or revise any forward-looking statements because of new information, future events or otherwise.
This press release contains certain non-GAAP financial measures as defined by SEC Regulation G. A reconciliation of each such measure to its most directly comparable GAAP financial measure, together with an explanation of why management believes that these non-GAAP financial measures provide useful information to investors, is provided herein.
Adjusted Operating Income (Loss), or AOI, is a non-GAAP financial measure that we define as operating income (loss) before certain stock-based compensation expense, loss (gain) on disposal of operating assets, depreciation and amortization (including goodwill impairment), amortization of non-recoupable ticketing contract advances and acquisition expenses (including transaction costs, changes in the fair value of accrued acquisition-related contingent consideration obligations, and acquisition-related severance and compensation). We also exclude from AOI the impact of estimated or realized liabilities for settlements or damages arising out of the Astroworld matter that exceed our estimated insurance recovery, due to the significant and non-recurring nature of the matter, which involved multiple fatalities and injury claims. Ongoing legal costs associated with defense of these claims, such as attorney fees, are not excluded from AOI. We use AOI to evaluate the performance of our operating segments. We believe that information about AOI assists investors by allowing them to evaluate changes in the operating results of our portfolio of businesses separate from non-operational factors that affect net income (loss), thus providing insights into both operations and the other factors that affect reported results. AOI is not calculated or presented in accordance with GAAP. A limitation of the use of AOI as a performance measure is that it does not reflect the periodic costs of certain amortizing assets used in generating revenue in our business. Accordingly, AOI should be considered in addition to, and not as a substitute for, operating income (loss), net income (loss), and other measures of financial performance reported in accordance with GAAP. Furthermore, this measure may vary among other companies; thus, AOI as presented herein may not be comparable to similarly titled measures of other companies.
Constant Currency is a non-GAAP financial measure when applied to a GAAP financial measure. We calculate currency impacts as the difference between current period activity translated using the current period’s currency exchange rates and the comparable prior period’s currency exchange rates. We present constant currency information to provide a framework for assessing how our underlying businesses performed excluding the effect of foreign currency rate fluctuations.
Free Cash Flow — Adjusted, or FCF, is a non-GAAP financial measure that we define as net cash provided by (used in) operating activities less changes in operating assets and liabilities, less maintenance capital expenditures, less distributions to noncontrolling interest partners. We use FCF among other measures, to evaluate the ability of operations to generate cash that is available for purposes other than maintenance capital expenditures. We believe that information about FCF provides investors with an important perspective on the cash available to service debt, make acquisitions, and for revenue generating capital expenditures. FCF is not calculated or presented in accordance with GAAP. A limitation of the use of FCF as a performance measure is that it does not necessarily represent funds available for operations and is not necessarily a measure of our ability to fund our cash needs. Accordingly, FCF should be considered in addition to, and not as a substitute for, net cash provided by (used in) operating activities and other measures of financial performance reported in accordance with GAAP. Furthermore, this measure may vary among other companies; thus, FCF as presented herein may not be comparable to similarly titled measures of other companies.
Free Cash is a non-GAAP financial measure that we define as cash and cash equivalents less ticketing-related client funds, less event-related deferred revenue, less accrued expenses due to artists and cash collected on behalf of others, plus event-related prepaids. We use free cash as a proxy for how much cash we have available to, among other things, optionally repay debt balances, make acquisitions and fund revenue generating capital expenditures. Free cash is not calculated or presented in accordance with GAAP. A limitation of the use of free cash as a performance measure is that it does not necessarily represent funds available from operations and it is not necessarily a measure of our ability to fund our cash needs. Accordingly, free cash should be considered in addition to, and not as a substitute for, cash and cash equivalents and other measures of financial performance reported in accordance with GAAP. Furthermore, this measure may vary among other companies; thus, free cash as presented herein may not be comparable to similarly titled measures of other companies.
LIVE NATION ENTERTAINMENT, INC.
CONSOLIDATED BALANCE SHEETS
(unaudited)
| | | | | | | | | | | |
| March 31,
2024 | | December 31,
2023 |
| (in thousands) |
| ASSETS | | | |
| Current assets | | | |
| Cash and cash equivalents | $ | 6,501,709 | | | $ | 6,231,866 | |
| Accounts receivable, less allowance of $73,157 and $82,350, respectively | 2,279,906 | | | 2,069,054 | |
| Prepaid expenses | 1,474,295 | | | 1,147,581 | |
| Restricted cash | 7,640 | | | 7,090 | |
| Other current assets | 164,230 | | | 122,163 | |
| Total current assets | 10,427,780 | | | 9,577,754 | |
| Property, plant and equipment, net | 2,116,632 | | | 2,101,463 | |
| Operating lease assets | 1,577,490 | | | 1,606,389 | |
| Intangible assets | | | |
| Definite-lived intangible assets, net | 1,162,783 | | | 1,161,621 | |
| Indefinite-lived intangible assets, net | 377,894 | | | 377,349 | |
| Goodwill | 2,699,480 | | | 2,691,466 | |
| Long-term advances | 608,506 | | | 623,154 | |
| Other long-term assets | 1,059,624 | | | 934,849 | |
| Total assets | $ | 20,030,189 | | | $ | 19,074,045 | |
| LIABILITIES AND EQUITY | | | |
| Current liabilities | | | |
| Accounts payable, client accounts | $ | 1,878,540 | | | $ | 1,866,864 | |
| Accounts payable | 248,196 | | | 267,493 | |
| Accrued expenses | 2,766,166 | | | 3,006,281 | |
| Deferred revenue | 5,025,357 | | | 3,398,028 | |
| Current portion of long-term debt, net | 1,137,262 | | | 1,134,386 | |
| Current portion of operating lease liabilities | 159,372 | | | 158,421 | |
| Other current liabilities | 113,517 | | | 128,430 | |
| Total current liabilities | 11,328,410 | | | 9,959,903 | |
| Long-term debt, net | 5,082,211 | | | 5,459,026 | |
| Long-term operating lease liabilities | 1,642,377 | | | 1,686,091 | |
| | | |
| Other long-term liabilities | 524,454 | | | 488,159 | |
| Commitments and contingent liabilities | | | |
| Redeemable noncontrolling interests | 983,550 | | | 893,709 | |
| Stockholders' equity | | | |
| | | |
| | | |
| Common stock | 2,302 | | | 2,298 | |
| Additional paid-in capital | 2,308,595 | | | 2,367,918 | |
| Accumulated deficit | (2,454,682) | | | (2,407,949) | |
| Cost of shares held in treasury | (6,865) | | | (6,865) | |
| Accumulated other comprehensive income | 35,818 | | | 27,450 | |
| Total Live Nation stockholders' equity | (114,832) | | | (17,148) | |
| Noncontrolling interests | 584,019 | | | 604,305 | |
| Total equity | 469,187 | | | 587,157 | |
| Total liabilities and equity | $ | 20,030,189 | | | $ | 19,074,045 | |
LIVE NATION ENTERTAINMENT, INC.
CONSOLIDATED STATEMENTS OF OPERATIONS
(unaudited)
| | | | | | | | | | | | | | | | | |
| | | | Three Months Ended March 31, |
| | | | | | 2024 | | 2023 | | |
| | | | | | (in thousands, except share and per share data) |
| Revenue | | | | | $ | 3,799,529 | | | $ | 3,127,390 | | | |
| Operating expenses: | | | | | | | | | |
| Direct operating expenses | | | | | 2,646,457 | | | 2,115,589 | | | |
| Selling, general and administrative expenses | | | | | 981,559 | | | 690,321 | | | |
| Depreciation and amortization | | | | | 132,594 | | | 115,185 | | | |
| Loss (gain) on disposal of operating assets | | | | | (651) | | | 504 | | | |
| Corporate expenses | | | | | 76,077 | | | 63,015 | | | |
| Operating income (loss) | | | | | (36,507) | | | 142,776 | | | |
| Interest expense | | | | | 80,691 | | | 89,215 | | | |
| Loss on extinguishment of debt | | | | | — | | | 18,366 | | | |
| Interest income | | | | | (43,257) | | | (40,313) | | | |
| Equity in earnings of nonconsolidated affiliates | | | | | (84) | | | (4,107) | | | |
| | | | | | | | | |
| Other expense (income), net | | | | | (77,054) | | | 11,583 | | | |
| Income before income taxes | | | | | 3,197 | | | 68,032 | | | |
| Income tax expense | | | | | 35,414 | | | 23,840 | | | |
| Net income (loss) | | | | | (32,217) | | | 44,192 | | | |
| Net income attributable to noncontrolling interests | | | | | 14,516 | | | 47,361 | | | |
| Net loss attributable to common stockholders of Live Nation | | | | | $ | (46,733) | | | $ | (3,169) | | | |
| | | | | | | | | |
| Basic and diluted net loss per common share available to common stockholders of Live Nation | | | | | $ | (0.53) | | | $ | (0.25) | | | |
| | | | | | | | | |
| | | | | | | | | |
| Weighted average common shares outstanding: | | | | | | | | | |
| Basic and diluted | | | | | 229,471,184 | | | 228,162,831 | | | |
| | | | | | | | | |
| | | | | | | | | |
| | | | | | | | | |
| Reconciliation to net loss available to common stockholders of Live Nation: | | |
| Net loss attributable to common stockholders of Live Nation | | | | | $ | (46,733) | | | $ | (3,169) | | | |
| Accretion of redeemable noncontrolling interests | | | | | (75,109) | | | (54,933) | | | |
| Net loss available to common stockholders of Live Nation—basic and diluted | | | | | $ | (121,842) | | | $ | (58,102) | | | |
| | | | | | | | | |
| | | | | | | | | |
| | | | | | | | | |
LIVE NATION ENTERTAINMENT, INC.
CONSOLIDATED STATEMENTS OF CASH FLOWS
(unaudited)
| | | | | | | | | | | | | | | | | |
| Three Months Ended March 31, | | | | |
| | 2024 | | 2023 | | | | | | |
| (in thousands) | | | | |
| CASH FLOWS FROM OPERATING ACTIVITIES | | | | | | | | | |
| Net income (loss) | $ | (32,217) | | | $ | 44,192 | | | | | | | |
| Reconciling items: | | | | | | | | | |
| Depreciation | 70,589 | | | 57,710 | | | | | | | |
| Amortization | 62,005 | | | 57,475 | | | | | | | |
| Amortization of non-recoupable ticketing contract advances | 24,080 | | | 20,363 | | | | | | | |
| Deferred income tax benefit | (5,729) | | | (2,550) | | | | | | | |
| Amortization of debt issuance costs and discounts | 3,943 | | | 4,630 | | | | | | | |
| Loss on extinguishment of debt | — | | | 18,366 | | | | | | | |
| Stock-based compensation expense | 31,402 | | | 27,571 | | | | | | | |
| Unrealized changes in fair value of contingent consideration | 12,807 | | | 9,702 | | | | | | | |
| | | | | | | | | |
| Equity in losses of nonconsolidated affiliates, net of distributions | 3,571 | | | 7,793 | | | | | | | |
| Provision for uncollectible accounts receivable | 1,248 | | | 6,054 | | | | | | | |
| Gain on mark-to-market of investments in nonconsolidated affiliates | (89,840) | | | (668) | | | | | | | |
| Other, net | (10,386) | | | 2,911 | | | | | | | |
| Changes in operating assets and liabilities, net of effects of acquisitions and dispositions: | | | | | | | | | |
| Increase in accounts receivable | (217,998) | | | (163,603) | | | | | | | |
| Increase in prepaid expenses and other assets | (360,997) | | | (369,494) | | | | | | | |
| Decrease in accounts payable, accrued expenses and other liabilities | (185,039) | | | (460,749) | | | | | | | |
| Increase in deferred revenue | 1,681,431 | | | 1,896,145 | | | | | | | |
| Net cash provided by operating activities | 988,870 | | | 1,155,848 | | | | | | | |
| CASH FLOWS FROM INVESTING ACTIVITIES | | | | | | | | | |
| Advances of notes receivable | (31,495) | | | (33,579) | | | | | | | |
| Collections of notes receivable | 2,639 | | | 2,825 | | | | | | | |
| Investments made in nonconsolidated affiliates | (12,392) | | | (6,455) | | | | | | | |
| Purchases of property, plant and equipment | (134,053) | | | (116,886) | | | | | | | |
| Cash acquired from acquisitions, net of cash paid | 10,010 | | | 96,382 | | | | | | | |
| Purchases of intangible assets | (11,673) | | | — | | | | | | | |
| | | | | | | | | |
| Other, net | 6,265 | | | (2,076) | | | | | | | |
| Net cash used in investing activities | (170,699) | | | (59,789) | | | | | | | |
| CASH FLOWS FROM FINANCING ACTIVITIES | | | | | | | | | |
| Proceeds from long-term debt, net of debt issuance costs | 562 | | | 987,793 | | | | | | | |
| Payments on long-term debt | (373,253) | | | (604,584) | | | | | | | |
| Contributions from noncontrolling interests | 28 | | | 5,944 | | | | | | | |
| Distributions to noncontrolling interests | (56,162) | | | (54,915) | | | | | | | |
| Purchases of noncontrolling interests, net | (8,795) | | | (21,606) | | | | | | | |
| Payments for capped call transactions | — | | | (75,500) | | | | | | | |
| Proceeds from exercise of stock options | 1,787 | | | 994 | | | | | | | |
| Taxes paid for net share settlement of equity awards | (25,483) | | | (7,949) | | | | | | | |
| Payments for deferred and contingent consideration | (16,421) | | | (2,606) | | | | | | | |
| Other, net | (619) | | | (1,870) | | | | | | | |
| Net cash provided by (used in) financing activities | (478,356) | | | 225,701 | | | | | | | |
| Effect of exchange rate changes on cash, cash equivalents and restricted cash | (69,422) | | | 63,318 | | | | | | | |
| Net increase in cash, cash equivalents, and restricted cash | 270,393 | | | 1,385,078 | | | | | | | |
| Cash, cash equivalents and restricted cash at beginning of period | 6,238,956 | | | 5,612,374 | | | | | | | |
| Cash, cash equivalents and restricted cash at end of period | $ | 6,509,349 | | | $ | 6,997,452 | | | | | | | |
| | | | | | | | | |
| | | | | | | | | |
| | | | | | | | | |
| | | | | | | | | |